
You’re about to set your pricing for the first time. You know your costs. You know what competitors charge. But you don’t know the one number that matters most: how many customers you need before you stop losing money every month.
A SaaS break-even calculator shows exactly when your monthly recurring revenue covers all fixed and variable costs. It combines your hosting expenses, salaries, customer acquisition cost, churn rate, and pricing into a single timeline that tells you how many customers you need and how long it takes to reach profitability. This calculation directly informs your pricing strategy and growth targets.
What makes SaaS break-even different from traditional business models
Traditional break-even analysis assumes you sell a product once and earn immediate gross profit. SaaS works differently.
You earn revenue over time through subscriptions. Your customer acquisition cost hits upfront, but revenue trickles in monthly. You might spend $500 to acquire a customer who pays $50 per month, meaning you’re underwater for ten months before that customer becomes profitable.
Churn complicates everything further. A customer who cancels after six months never reaches individual profitability, even though they contributed to covering fixed costs.
Your break-even point isn’t just about covering costs. It’s about understanding when your recurring revenue engine becomes self-sustaining.
Most founders who price their SaaS product when they have zero customers skip this calculation entirely. They pick a number that feels right, launch, and hope math works out.
Core inputs every SaaS break-even calculator needs
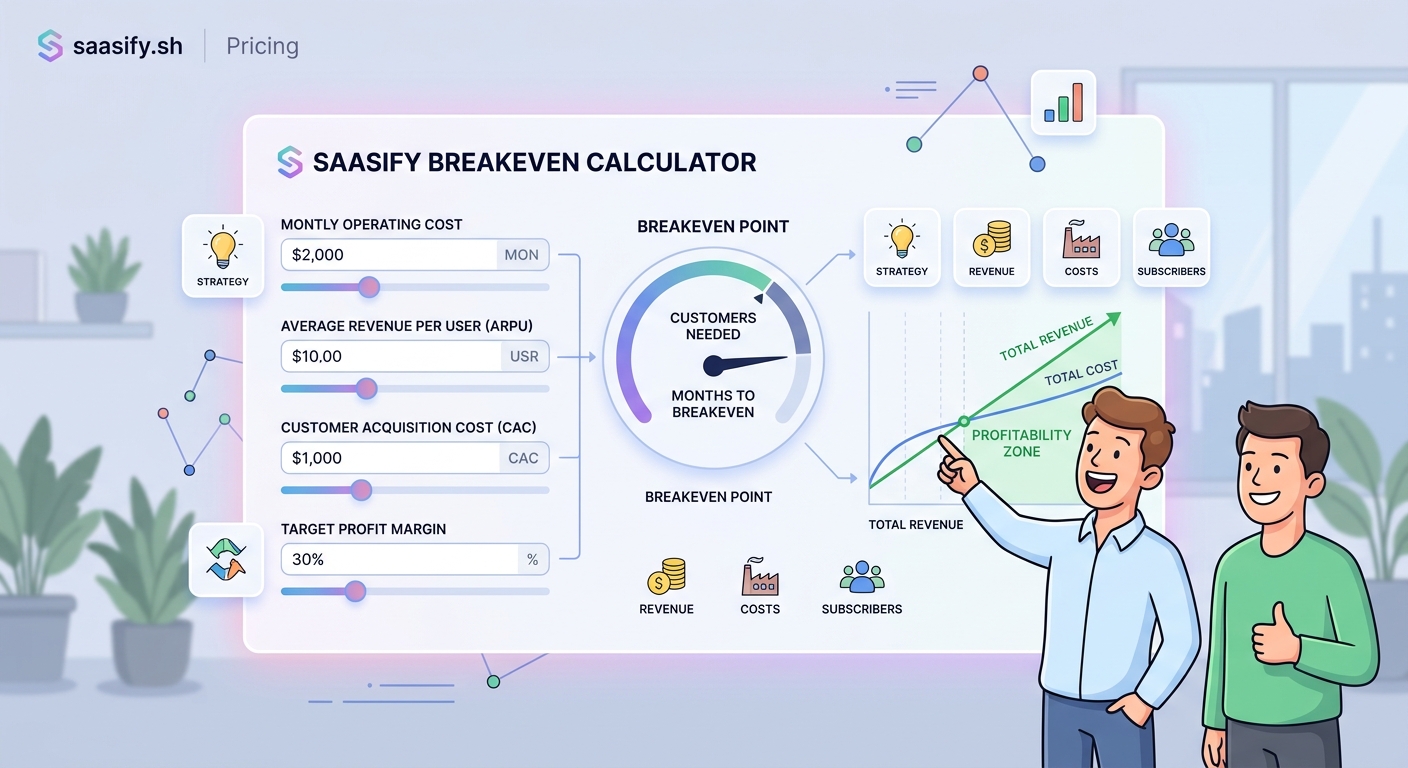
Your calculator needs five categories of data to produce useful results.
Fixed costs include everything that stays constant regardless of customer count:
- Salaries and contractor payments
- Office rent or coworking memberships
- Software subscriptions for internal tools
- Insurance and legal fees
- Marketing retainers or fixed ad spend
Variable costs scale with customers:
- Hosting and infrastructure per user
- Transaction fees from payment processors
- Support hours per customer
- Third-party API costs that scale with usage
Revenue metrics define what you earn:
- Monthly recurring revenue per customer
- Average contract value for annual plans
- Setup fees or onboarding charges
- Expansion revenue from upsells
Customer acquisition metrics show what you spend to grow:
- Customer acquisition cost across all channels
- Sales cycle length from first touch to payment
- Conversion rates at each funnel stage
Retention metrics determine how long value lasts:
- Monthly churn rate as a percentage
- Net revenue retention including expansions
- Average customer lifetime in months
Miss any of these inputs and your calculation becomes fiction. Underestimate hosting costs by 30% and your break-even timeline shifts by months.
Building your break-even calculation step by step
Start with the basic formula, then layer in SaaS-specific complexity.
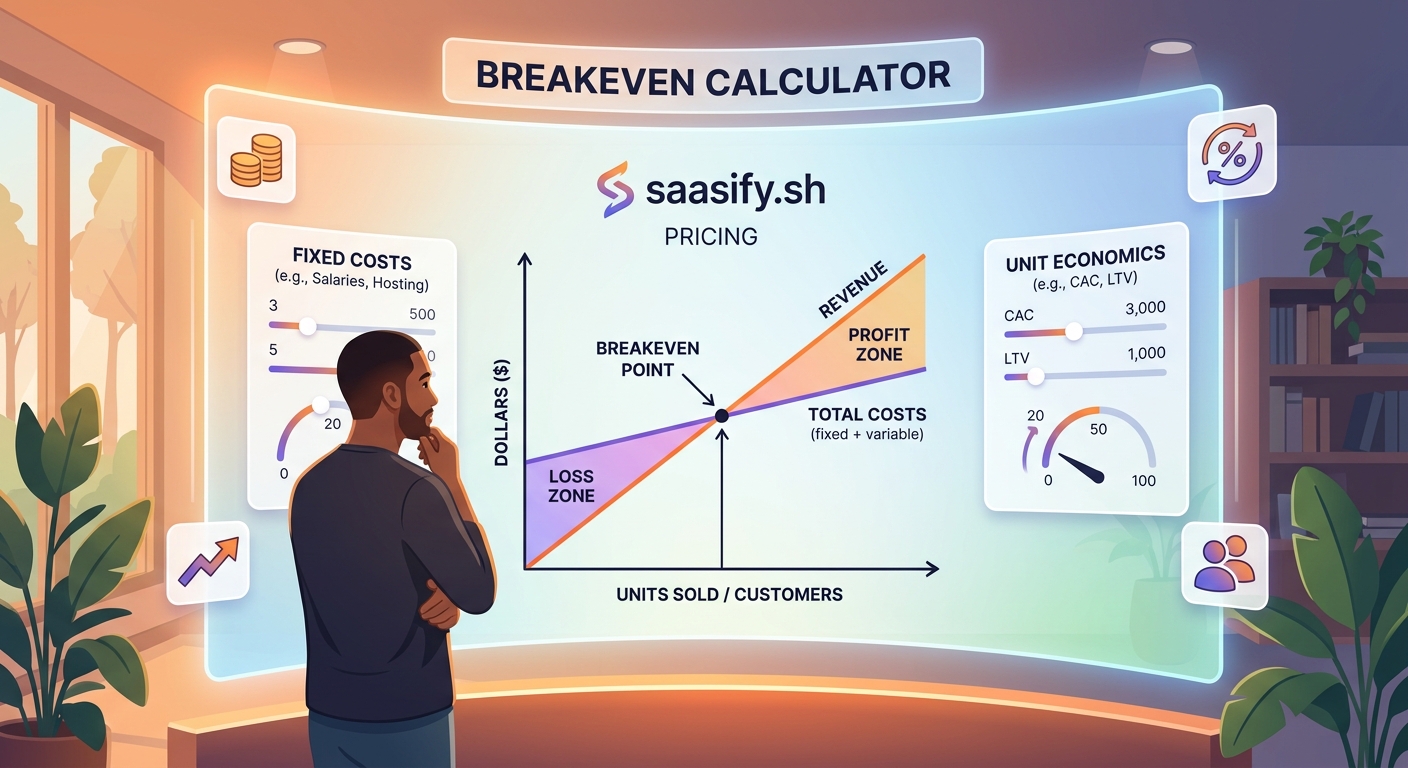
Step 1: Calculate your monthly fixed costs
Add up everything you pay regardless of customer count. Include your own salary if you’re paying yourself. If you’re not, note that as deferred compensation that will eventually become a fixed cost.
Example: $15,000 per month for a two-person team with basic tooling.
Step 2: Determine your contribution margin per customer
Take your monthly revenue per customer and subtract the variable cost to serve that customer.
If you charge $99 per month and it costs $12 in hosting, payment processing, and support, your contribution margin is $87 per customer per month.
Step 3: Calculate customers needed to cover fixed costs
Divide your monthly fixed costs by your contribution margin per customer.
$15,000 ÷ $87 = 173 customers
That’s your break-even customer count assuming zero churn and ignoring acquisition costs.
Step 4: Factor in customer acquisition cost
If your CAC is $500 and your contribution margin is $87 per month, each customer needs to stick around for at least six months just to recover acquisition cost before contributing to fixed costs.
This is where most break-even calculators fail. They treat CAC as a one-time expense instead of a continuous investment that delays profitability.
Step 5: Account for churn in your timeline
With 5% monthly churn, you lose customers as fast as you gain them once you reach a certain size. Your break-even timeline extends because you need to replace churned customers while still growing toward your target count.
A revenue dashboard that actually drives growth decisions tracks these metrics in real time so you can adjust before problems compound.
The math that most founders get wrong
Here’s what breaks in simple break-even calculations.
| Common mistake | Why it matters | How to fix it |
|---|---|---|
| Ignoring CAC payback period | You treat customers as immediately profitable when they’re actually underwater for months | Calculate months to recover CAC before counting toward fixed cost coverage |
| Using average customer value | Power law distribution means most customers are worth less than average | Use median customer value or segment by tier |
| Forgetting expansion revenue | Customers who upgrade change your unit economics over time | Model expansion as a separate revenue stream with its own timeline |
| Treating churn as linear | Churn compounds, especially if you lose high-value customers first | Weight churn by customer segment and revenue impact |
| Excluding founder salary | You can’t work for free forever | Include realistic compensation even if you’re deferring it |
The biggest error is assuming you can acquire customers at a steady rate. Most SaaS companies see lumpy growth. You might add 20 customers one month and 3 the next.
Your break-even calculator needs to account for realistic growth curves, not straight-line projections.
Scenario planning with your calculator
The real power comes from testing different assumptions.
Run these three scenarios:
- Conservative case: Lower pricing, higher churn, slower acquisition
- Base case: Your best estimates with current data
- Optimistic case: Better retention, faster growth, higher willingness to pay
Your conservative case should assume everything goes slightly wrong. Churn is 7% instead of 5%. CAC is 20% higher than projected. Conversion rates are 30% lower.
If your conservative case still reaches break-even within 18 months, you have a viable business. If it takes 36 months, you need more runway or better unit economics.
“I run break-even scenarios every time we consider a pricing change or new acquisition channel. The calculator forces us to be honest about what needs to be true for a decision to work. It’s saved us from three expensive mistakes in the past year.”
Test how different pricing tiers affect your timeline. A $49 plan might need 300 customers to break even, while a $199 plan needs only 75. But the $199 plan might take twice as long to acquire each customer.
Using break-even analysis to set prices
Your break-even point directly informs pricing strategy.
If you need 500 customers at $50 per month to break even, but your market can only support 200 customers total, you have two options: raise prices to $125 or cut costs dramatically.
Most founders validate their SaaS idea before writing code but skip validating their unit economics. They build something people want at a price that can never support a business.
Your calculator reveals the minimum viable price for sustainability. You can always charge more, but charging less means you need proportionally more customers to survive.
Consider your total addressable market. If you’re targeting a profitable micro-SaaS niche with 5,000 potential customers, and you need 2,000 to break even, you’re trying to capture 40% market share. That’s unrealistic for most markets.
Better to price higher and target 400 customers at 8% market share.
When to recalculate your break-even point
Your break-even point shifts constantly in the early days.
Recalculate monthly during your first year. Your hosting costs change as you optimize infrastructure. Your CAC drops as you learn which channels work. Your churn stabilizes as you figure out product-market fit.
Recalculate immediately when:
- You change pricing on any plan
- You add or remove a team member
- You discover a new acquisition channel with different economics
- Your churn rate changes by more than 1 percentage point
- You add features that increase hosting costs per user
Founders who build a SaaS MVP in 30 days often launch with placeholder pricing. That’s fine for testing demand, but you need real unit economics before scaling acquisition.
Common break-even mistakes that kill SaaS companies
Some founders obsess over break-even at the expense of growth. They cut marketing spend to reduce their customer count target, which extends the timeline to profitability because they’re acquiring fewer customers per month.
Others ignore break-even entirely and focus purely on growth. They raise prices later to fix unit economics, only to discover their early customers churn when grandfathered pricing expires.
The worst mistake is treating break-even as a one-time calculation. Your business evolves. Your costs change. Your pricing experiments succeed or fail. A static break-even analysis becomes obsolete within weeks.
Build a living model you update monthly. Track actual performance against projections. Adjust assumptions based on real data.
Key indicators your break-even analysis is wrong:
- Your actual CAC is 50%+ higher than projected
- Churn is concentrated in customers acquired from specific channels
- Variable costs are growing faster than customer count
- Revenue per customer is declining month over month
- You’re hitting customer count targets but still losing money
That last one happens when your contribution margin is negative. You lose money on every customer, and volume makes it worse. No amount of scale fixes negative unit economics.
Tools and templates for break-even calculation
You don’t need fancy software. A spreadsheet works fine for most early-stage SaaS companies.
Build a simple model with these columns:
- Month number
- New customers acquired
- Total active customers (accounting for churn)
- Monthly recurring revenue
- Fixed costs
- Variable costs
- Net profit or loss
- Cumulative cash position
Project forward 24 months. Use formulas to calculate churn impact and cumulative totals automatically.
Update your actuals monthly and compare against projections. If you’re consistently off by more than 20%, your assumptions need revision.
Some founders prefer dedicated financial modeling tools, but most add complexity without improving decisions. A clear spreadsheet beats a complicated dashboard you don’t understand.
Break-even versus profitability timelines
Reaching break-even means you stop losing money each month. Reaching profitability means you’ve recovered all cumulative losses and your bank account is growing.
If you spend $100,000 before reaching break-even, you need months of positive cash flow to recover that investment. Your profitability date comes much later than your break-even date.
This matters for fundraising. Investors want to know both timelines. Break-even shows your business model works. Profitability shows you can return capital.
Founders who build a pre-launch waitlist sometimes reach break-even within their first month because they launch with revenue. But they still need to recover development costs before claiming true profitability.
Adjusting your model as you scale
Your break-even calculation changes dramatically as you grow.
Early stage fixed costs are mostly salaries. At scale, they include office space, management layers, and enterprise tooling.
Early stage CAC comes from founder time and small ad budgets. At scale, you’re paying sales teams, running enterprise deals with six-month cycles, and investing in brand marketing with delayed returns.
Your contribution margin often improves with scale as you negotiate better hosting rates and automate support. But it can also shrink if you move upmarket and need to provide white-glove onboarding.
Recalculate your break-even point for each new phase:
- Pre-launch to first 10 customers
- 10 to 100 customers
- 100 to 1,000 customers
- 1,000+ customers with a full team
Each phase has different economics. What works at 50 customers fails at 500.
Why your break-even timeline matters more than the number
Most founders fixate on the customer count needed to break even. The timeline matters more.
If you need 200 customers and can acquire 50 per month, you’ll break even in four months. If you can only acquire 10 per month, it takes 20 months.
Your runway determines whether that timeline is viable. Knowing you need 200 customers is useless if you run out of money at 150.
Calculate your monthly burn rate, divide by remaining cash, and compare that deadline to your break-even timeline. If your break-even date is after your cash-out date, you need to either raise money, cut costs, or accelerate growth.
This is where choosing between a soft launch and going big becomes critical. A big launch might compress your timeline to break-even but requires more upfront capital.
Making better decisions with break-even data
Your break-even calculator isn’t just a planning tool. It’s a decision-making framework.
When evaluating a new feature, calculate how it affects your break-even point. Does it increase willingness to pay enough to offset development and maintenance costs? Does it reduce churn enough to improve your timeline?
When considering a new marketing channel, model the impact on CAC and acquisition rate. A channel with higher CAC might still improve your break-even timeline if it delivers customers faster.
When debating a price increase, project the impact on churn and new customer acquisition. Losing 10% of customers to churn might be worth it if the remaining 90% pay 30% more.
Every strategic decision changes your path to profitability. Your calculator quantifies the impact so you’re not guessing.
Your calculator is only as good as your assumptions
Garbage in, garbage out.
If you estimate CAC based on what you hope to spend rather than what channels actually cost, your break-even timeline is fantasy. If you assume 2% monthly churn because that’s what successful SaaS companies achieve, but you’re actually seeing 8%, you’re planning for a business that doesn’t exist.
Use real data wherever possible. When you don’t have data, use conservative estimates and clearly mark them as assumptions to revisit.
Track your assumptions in a separate tab. Note the date, the source, and your confidence level. Update them as you gather real performance data.
The founders who succeed aren’t the ones with the most optimistic projections. They’re the ones who update their models fastest when reality diverges from assumptions.
What to do when break-even feels impossible
Sometimes your calculator reveals an uncomfortable truth: your current model can’t reach break-even with available resources.
You have four levers to pull:
- Increase prices to improve contribution margin
- Decrease CAC by focusing on more efficient channels
- Reduce fixed costs by cutting team size or tools
- Raise capital to extend your runway until break-even
Most founders resist the first option because they’re afraid of losing customers. But pricing too low guarantees failure. Pricing too high might slow growth, but at least you have a path to sustainability.
The second option requires ruthless focus. Cut every marketing channel that doesn’t deliver customers at or below your target CAC. Double down on what works.
The third option hurts but sometimes saves the company. A smaller team that reaches profitability beats a larger team that runs out of money.
The fourth option only works if your unit economics are sound. Investors won’t fund a business that loses money on every customer, no matter how much you scale.
Numbers that tell you when to pivot
Your break-even calculator sometimes reveals you’re building the wrong business.
If your break-even point requires 10,000 customers but your total addressable market is 5,000, you’re targeting the wrong segment or pricing too low.
If your break-even timeline is 48 months but you only have 12 months of runway and no path to fundraising, you need to change something fundamental.
If your contribution margin is negative even after optimizing infrastructure and support, your pricing model is broken.
These aren’t reasons to quit. They’re signals to pivot before you waste more time and money on a model that can’t work.
Some of the most successful SaaS companies started with unit economics that didn’t work, recognized the problem early, and adjusted before running out of resources.
Building a business that works on paper and in practice
Your SaaS break-even calculator bridges the gap between theory and reality.
It forces you to confront hard truths about pricing, costs, and growth rates. It reveals whether your business model is viable before you scale something broken.
But calculation alone doesn’t build a business. You still need to acquire customers, retain them, and deliver value worth paying for.
Use your break-even analysis to set realistic targets. Track progress monthly. Adjust assumptions as you learn. Celebrate when you hit break-even, then keep building toward profitability.
The calculator is a tool. Your judgment about what to do with the insights matters more than the precision of the math.
Start with conservative assumptions. Build a simple model. Update it as you gather real data. Let it guide decisions without becoming paralyzed by analysis.
Your break-even point isn’t a destination. It’s a milestone on the path to building something sustainable.