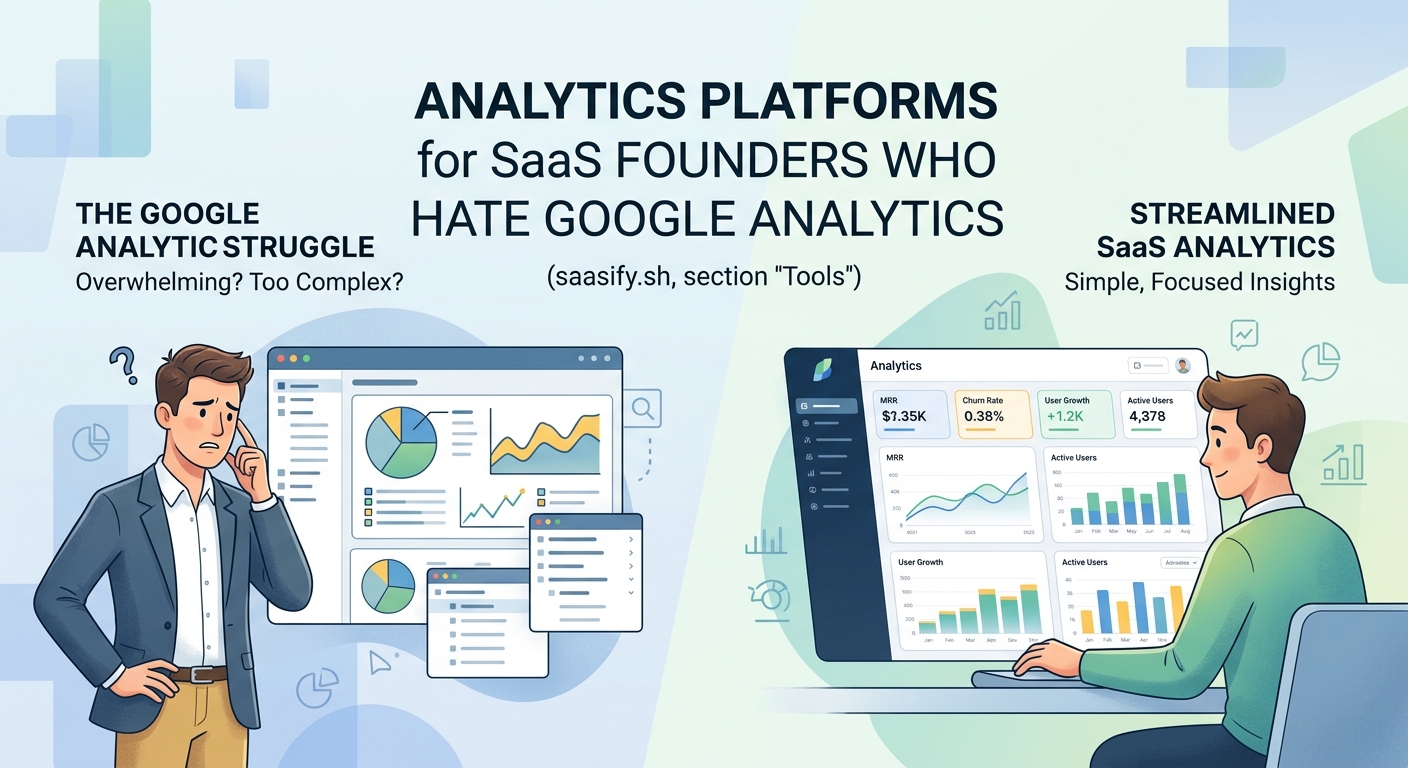
Google Analytics is powerful, but let’s be honest: most SaaS founders don’t need 90% of what it offers. You’re not running a content empire or managing a Fortune 500 marketing team. You need to know which features convert, where users drop off, and whether your pricing experiment worked. That’s it.
The problem? Google Analytics was built for a different era and a different audience. It’s overkill for indie founders who just want to make better product decisions without spending hours learning a new interface every time Google redesigns it.
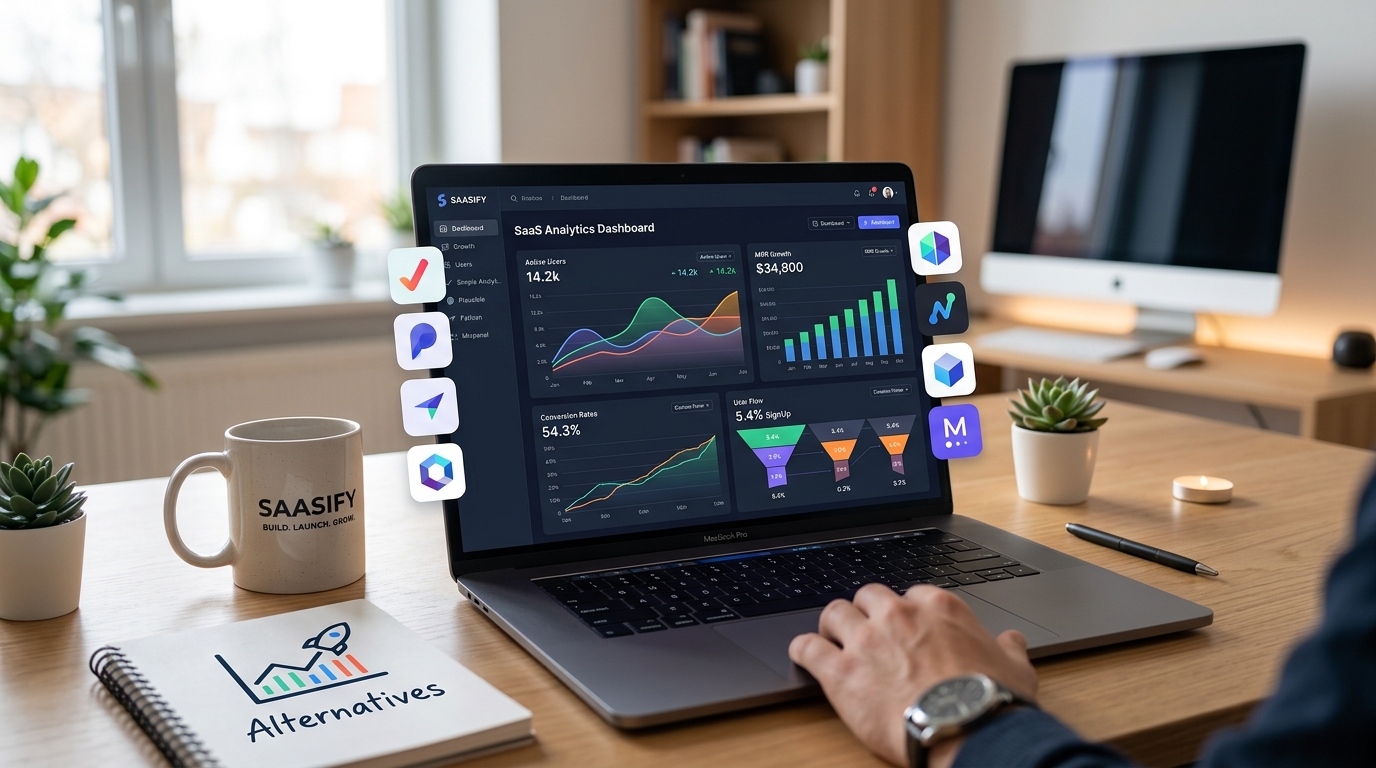
Modern google analytics alternatives focus on simplicity and product-specific metrics that SaaS founders actually use. Tools like Plausible, Fathom, and Mixpanel offer cleaner interfaces, better privacy compliance, and metrics that align with subscription business models. Most provide setup in under 15 minutes and pricing that scales with your growth, not your pageview count.
Why SaaS founders are ditching Google Analytics
Google Analytics wasn’t designed for subscription businesses. It tracks pageviews and sessions, but struggles with the metrics that matter for SaaS: trial conversions, feature adoption, cohort retention, and revenue attribution.
The interface has become increasingly complex. Universal Analytics gave way to GA4, forcing everyone to relearn the platform. Reports that used to take two clicks now require custom explorations and configuration. For a solo founder juggling development, support, and marketing, this time sink adds up.
Privacy regulations make implementation harder. GDPR and similar laws require cookie banners and consent management. Google Analytics falls into the category of tools that need explicit user permission in many jurisdictions. This creates friction in your onboarding flow and reduces the accuracy of your data.
Performance matters more than you think. Google Analytics adds significant load time to your pages. When you’re trying to optimize conversion rates, every millisecond counts. Lighter alternatives can improve your Core Web Vitals scores and user experience.
What to look for in analytics tools for SaaS

Event tracking should be straightforward. You need to track button clicks, form submissions, and feature usage without writing complex JavaScript. The best tools offer simple APIs and SDKs that let you instrument your app in minutes.
User-level tracking beats session-based analytics. SaaS businesses need to follow individual users across multiple sessions and devices. You want to see the complete journey from signup to paid customer, not just isolated browsing sessions.
Cohort analysis reveals retention patterns. You need to compare how different groups of users behave over time. Did users who signed up in January stick around longer than February signups? Which acquisition channel produces the best long-term customers?
Integration with your stack matters. Your analytics tool should connect with your payment processor, email service, and customer support platform. When building features users actually want, you need data from multiple sources in one place.
Real-time data helps you move faster. When you ship a new feature or change your pricing page, you want immediate feedback. Waiting 24 hours for Google Analytics to process data slows down your iteration cycle.
Simple analytics platforms that respect privacy
Plausible Analytics offers the cleanest interface you’ll find. One dashboard shows everything: top pages, referral sources, countries, and devices. No training required. No hidden menus. Just the metrics you check daily.
The script weighs less than 1KB. Your pages load faster, and you don’t need cookie consent banners in most cases. Plausible doesn’t collect personal data or use cookies, making GDPR compliance automatic.
Pricing starts at $9 per month for up to 10,000 monthly pageviews. It scales based on traffic, not features. Every plan includes unlimited team members and websites.
Fathom Analytics takes a similar approach with slightly different features. It offers email reports, uptime monitoring, and the ability to share dashboards with clients or investors. The interface feels more polished than Plausible, with better data visualization.
Fathom costs $14 per month for 100,000 pageviews. They offer a unique feature: you can use their EU isolation mode to keep all data on European servers if that matters for your compliance needs.
Both tools work well for content sites and simple SaaS dashboards. They track pageviews, referrers, and basic user behavior. But they’re limited for product analytics. You won’t get funnel analysis or user-level event tracking.
Product analytics tools built for SaaS metrics
Mixpanel focuses on user actions instead of pageviews. You track events like “clicked upgrade button” or “completed onboarding step three.” Then you analyze how these events correlate with conversion and retention.
The funnel builder shows exactly where users drop off. If 100 people start your trial but only 10 convert to paid, Mixpanel tells you which step loses the most users. You can segment by any property: acquisition source, plan type, company size, or custom attributes.
Cohort analysis comes built in. Compare retention curves for different user groups. See if your product improvements actually help users stick around longer.
The free plan covers 20 million events per month. That’s enough for most early-stage SaaS products. Paid plans start at $25 per month and scale based on data volume.
Amplitude competes directly with Mixpanel but includes behavioral cohorting. The platform automatically groups users based on actions they take, then shows you how these behavioral segments differ in retention and conversion.
The Amplitude Recommend feature suggests which events to track based on your product type. For a SaaS app, it might recommend tracking feature adoption, upgrade clicks, and cancellation flows.
Free tier includes 10 million events per month. Paid plans start around $50 per month but can get expensive as you scale. The pricing jumps significantly once you cross certain event thresholds.
PostHog gives you product analytics, feature flags, and session recording in one platform. The session replay feature lets you watch exactly how users interact with your interface. You can see where they get confused, what they click, and where they rage-click.
Feature flags integrate with your analytics. Launch features to 10% of users, measure the impact, then roll out to everyone if metrics improve. This makes running growth experiments much easier.
PostHog offers a generous free tier: 1 million events and 5,000 session recordings per month. The open-source version lets you self-host if data sovereignty matters for your business.
Comparison table for choosing the right tool
| Tool | Best For | Starting Price | Key Strength | Main Limitation |
|---|---|---|---|---|
| Plausible | Simple traffic tracking | $9/month | Easiest setup, privacy-first | No user-level tracking |
| Fathom | Marketing sites | $14/month | Beautiful dashboards | Limited product analytics |
| Mixpanel | Event-based analysis | $25/month | Powerful funnels | Steep learning curve |
| Amplitude | Behavioral insights | $50/month | Auto-cohort detection | Expensive at scale |
| PostHog | All-in-one product suite | Free tier available | Session replay included | Resource-intensive to self-host |
| Heap | Automatic event capture | $3,600/year | No manual tracking needed | Expensive for small teams |
Setting up your first analytics alternative
Start with a clear goal. Don’t try to track everything on day one. Pick three metrics that matter most for your current stage. Early-stage founders usually focus on signup conversion, activation rate, and weekly active users.
- Create your account and add the tracking script to your site header.
- Define your key events (signup, trial start, first value moment, upgrade).
- Implement event tracking using the platform’s SDK or API.
- Set up a simple dashboard with your three core metrics.
- Test the implementation by completing user actions yourself.
- Share dashboard access with your team or advisors.
Most platforms provide code snippets for popular frameworks. If you’re using React, Vue, or Next.js, you’ll find official libraries that make implementation trivial.
The hardest part is deciding what to track. Focus on user actions that indicate progress toward becoming a paying customer. For a project management tool, that might be: created first project, invited team member, created first task, marked task complete.
“The best analytics setup is the one you actually check every day. If your dashboard is too complex or shows metrics you don’t understand, you’ll stop looking at it. Start simple, then add complexity only when you need it.” – Advice from a founder who’s tried seven different analytics platforms
Common mistakes when switching analytics platforms
Trying to replicate your entire Google Analytics setup wastes time. You probably only used 10% of those reports anyway. Start fresh and build only what you need.
Not tracking revenue data creates blind spots. Connect your analytics to Stripe, Paddle, or whatever payment processor you use. Revenue attribution tells you which acquisition channels actually make money, not just which ones bring traffic.
Ignoring data migration can lose historical context. Most platforms let you import past data via API. Even if you can’t get everything, import at least six months of key metrics so you can spot trends.
Forgetting to update your privacy policy causes legal issues. When you change analytics providers, update your terms to reflect the new data collection practices. This matters especially if you’re moving from Google Analytics to a privacy-focused tool.
Over-segmenting your data early makes everything harder. You don’t need to track 50 different user properties when you have 100 users. Add segments as patterns emerge and questions arise.
Integrating analytics with your growth strategy
Analytics tools work best when connected to your entire stack. Link your analytics platform with your email service to track how campaigns affect product usage. Connect it to your support tool to see if confused users correlate with specific features or flows.
When planning your launch strategy, set up tracking before you announce anything. You want data from day one so you can measure launch impact accurately.
Create alerts for important metrics. Most platforms let you set up notifications when conversion rates drop or error rates spike. This helps you catch problems before they affect too many users.
Build a weekly review habit. Pick one day to check your metrics, note interesting patterns, and decide on one experiment to run. This rhythm keeps you data-informed without becoming data-obsessed.
Share dashboards with your team or advisors. Public accountability makes you more likely to act on insights. When others can see your metrics, you’re motivated to improve them.
Advanced features worth considering later
Heatmaps show where users click and how far they scroll. Tools like Hotjar or Microsoft Clarity add this layer on top of your main analytics. Useful for optimizing landing pages and signup flows.
A/B testing platforms like Split or Optimizely let you run experiments without deploying new code. Change button colors, headlines, or entire page layouts for different user segments.
Customer data platforms like Segment or RudderStack act as a central hub. You send events to them once, and they route data to all your other tools. This makes switching analytics platforms easier since your tracking code doesn’t change.
Data warehouses become important at scale. Once you’re processing millions of events, you might want to store raw data in BigQuery or Snowflake for custom analysis. But this is overkill for most indie SaaS products under $100K ARR.
Pricing models that scale with your business
Pageview-based pricing works for content sites but penalizes successful SaaS products. As your product grows, your pageviews increase even if your user count stays flat. This pricing model doesn’t align with your business model.
Event-based pricing makes more sense for product analytics. You pay for the actions users take, not how many pages they visit. This scales more predictably with actual product usage.
User-based pricing charges per tracked user. This aligns perfectly with SaaS growth. As you add customers, your analytics costs increase proportionally. Tools like Amplitude and PostHog offer this model.
Flat-rate pricing provides the most predictability. You pay a fixed amount regardless of usage, up to certain limits. This works well when you’re building your MVP and don’t want surprise bills.
Making the switch without losing momentum
Run both platforms in parallel for two weeks. This lets you verify that your new setup captures everything important. Compare key metrics side by side to catch any tracking gaps.
Export historical data before you cancel Google Analytics. Even if you can’t import it into your new platform, keep CSV files of your most important reports. You’ll reference this data when analyzing long-term trends.
Document your tracking plan in a simple spreadsheet. List every event you track, what it measures, and why it matters. This helps future you remember what you set up and makes onboarding team members easier.
Update your revenue dashboard to pull from the new analytics platform. This ensures you’re making decisions based on current data, not outdated information.
Tools that combine analytics with other features
June focuses specifically on B2B SaaS metrics. It automatically calculates activation rate, retention curves, and feature adoption without manual configuration. The platform connects to your database and figures out the important metrics based on your schema.
Pricing starts at $99 per month for up to 1,000 active users. It’s more expensive than basic analytics but cheaper than hiring a data analyst.
Baremetrics works exclusively with Stripe. If you process payments through Stripe, Baremetrics automatically calculates MRR, churn, LTV, and other subscription metrics. No event tracking required.
The dashboard shows you exactly what subscription businesses need: new customers, upgrades, downgrades, cancellations, and net revenue. It costs $50 per month for up to $10K MRR.
ChartMogul competes with Baremetrics but supports more payment processors. It handles Stripe, Braintree, Recurly, and others. The subscription analytics work the same way: automatic calculation of SaaS metrics from payment data.
Pricing starts at $100 per month and scales based on your MRR. Both ChartMogul and Baremetrics become expensive as you grow, but they save hours of manual calculation and spreadsheet maintenance.
Building a metrics stack that grows with you
Start with one simple analytics tool and your payment processor’s built-in reporting. That’s enough to get to your first ten paying customers. Don’t over-invest in analytics infrastructure before you have product-market fit.
Add product analytics when you start optimizing conversion funnels. This usually happens after you have 50-100 active users and enough data to spot patterns. Tools like Mixpanel or PostHog become valuable at this stage.
Layer in specialized tools as specific needs emerge. If churn becomes a problem, add subscription analytics. If you’re experimenting with pricing, add A/B testing. Build your stack incrementally based on actual problems, not hypothetical ones.
Consider a customer data platform when you’re juggling five or more tools. At that point, the complexity of maintaining tracking code in multiple places justifies the cost and effort of a centralized system.
Privacy-first analytics and legal compliance
GDPR changed how we think about analytics. The regulation requires explicit consent for tracking that can identify individuals. Google Analytics falls into this category because it shares data with Google’s advertising network.
Privacy-focused alternatives like Plausible and Fathom don’t require cookie consent in most cases. They don’t collect personal data or use cookies, making compliance much simpler. This removes friction from your signup flow and improves data accuracy.
Some jurisdictions require data localization. If you serve customers in the EU, you might need to keep their data on European servers. Tools like Fathom offer EU isolation, and PostHog lets you self-host in any region.
Anonymous tracking protects user privacy while still providing useful insights. You can track behavior patterns without knowing who specific users are. This approach satisfies most privacy regulations while giving you the data you need to improve your product.
Getting your team to actually use analytics
Make dashboards public within your company. When metrics are visible, people pay attention to them. Create a shared screen in your office or a dedicated Slack channel that posts daily updates.
Connect metrics to individual responsibilities. Your designer should track signup conversion. Your developer should monitor error rates and performance. When everyone owns specific metrics, the whole team becomes data-informed.
Tell stories with your data. Numbers alone don’t motivate action. Instead of saying “conversion rate is 12%,” say “we’re losing 88 out of every 100 visitors who reach our pricing page. Let’s figure out why.”
Celebrate improvements publicly. When someone’s experiment moves a metric, share the win with the team. This reinforces the value of checking analytics and running experiments.
Keep dashboards simple enough that anyone can understand them at a glance. If your CEO, designer, and developer can’t all look at the same dashboard and understand what’s happening, it’s too complex.
Choosing your analytics platform today
Google Analytics alternatives aren’t about finding a perfect replacement. They’re about picking a tool that matches how you actually work. SaaS founders need simple interfaces, product-specific metrics, and pricing that scales sensibly.
Start with the simplest tool that meets your current needs. You can always switch later, and most platforms make migration relatively painless. The worst choice is sticking with Google Analytics when it frustrates you daily and doesn’t answer your most important questions.
Your analytics platform should help you make better decisions, not become another project to maintain. Pick something that takes 15 minutes to set up, shows you the three metrics you check every day, and costs less than your coffee budget. Everything else is optional until your business demands it.