
Most founders track too many metrics and act on too few.
You open your analytics dashboard and see dozens of numbers. Page views, signups, sessions, clicks, downloads. Everything looks important. Nothing feels actionable. Your investor wants an update. Your team needs direction. And you’re stuck wondering which number actually tells you if your SaaS is healthy.
The truth is simpler than most metric guides suggest. You don’t need 47 KPIs on a color-coded spreadsheet. You need five core metrics that connect directly to cash, growth, and survival.
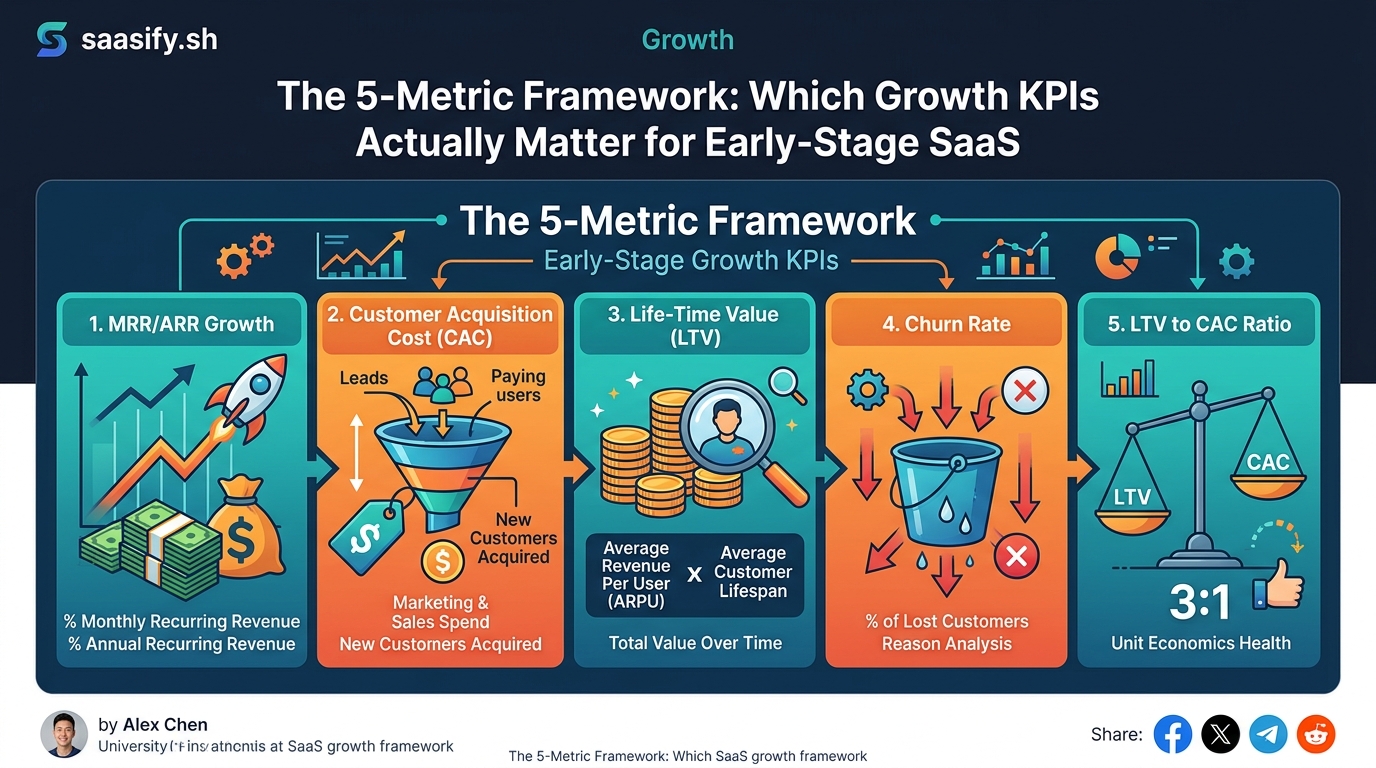
Early-stage SaaS founders should focus on five core metrics: Monthly Recurring Revenue, Net Revenue Retention, Customer Acquisition Cost, Cash Runway, and a single growth efficiency ratio. These KPIs directly inform product decisions, sales strategy, and fundraising conversations without creating analysis paralysis or relying on vanity metrics that don’t impact business survival.
Why Most SaaS Metrics Don’t Move the Needle
Vanity metrics feel good but don’t change behavior.
Total users sounds impressive in a pitch deck. But if half of them signed up, logged in once, and never came back, that number means nothing. Same with page views, social followers, or email opens. These metrics might correlate with success, but they don’t cause it.
The metrics that matter share three traits. They’re actionable, meaning you can change them through specific decisions. They’re comparable, so you can track improvement over time or against benchmarks. And they’re tied to revenue, either directly or through a clear causal chain.
If a metric doesn’t meet all three criteria, it’s probably a distraction.
Monthly Recurring Revenue Tells You If You’re Growing

MRR is the foundation of every other calculation.
It’s the total predictable revenue your business generates each month from subscriptions. Not one-time fees. Not usage overages. Just the recurring base that you can count on if nobody cancels and nobody upgrades.
Calculate it by adding up all active subscription values at the end of the month. A customer paying $99/month counts as $99. A customer on an annual plan at $1,188/year counts as $99 ($1,188 divided by 12).
Track MRR movement in four categories:
- New MRR from customers who didn’t exist last month
- Expansion MRR from existing customers who upgraded
- Contraction MRR from customers who downgraded
- Churned MRR from customers who canceled
Your net new MRR is the sum of these four. If you added $5,000 in new subscriptions, gained $1,200 from upgrades, lost $400 to downgrades, and lost $800 to cancellations, your net new MRR is $5,000. That’s healthy growth.
If your churned and contraction MRR exceeds new and expansion MRR, you’re shrinking. No amount of marketing spend fixes that until you solve retention.
When you’re building a revenue dashboard that actually drives growth decisions, MRR should sit at the top. Everything else flows from it.
Net Revenue Retention Shows If Your Product Actually Works
NRR measures whether existing customers spend more or less over time.
Start with your MRR from 12 months ago. Exclude any customers who joined after that date. Now look at how much revenue that same cohort generates today, including upgrades, downgrades, and cancellations.
If you had $10,000 MRR from 50 customers last January, and those same 50 customers now generate $11,500 (even though 5 canceled, 10 downgraded, and 15 upgraded), your NRR is 115%.
Anything above 100% means your product grows revenue without new customer acquisition. That’s the holy grail. It means your product delivers enough value that customers expand usage faster than others churn.
Anything below 90% is a red flag. You’re losing revenue faster than you can replace it. Growth becomes a treadmill. You need more and more new customers just to stand still.
“If your NRR is below 100%, you don’t have a growth problem. You have a product problem. Fix retention before you spend another dollar on ads.”
NRR also tells you where to focus. Low NRR means you need better onboarding, more product education, or features that encourage expansion. High NRR means your constraint is top-of-funnel, and you should invest in acquisition.
Customer Acquisition Cost Determines Your Growth Ceiling
CAC is how much you spend to acquire one new customer.
Add up all sales and marketing expenses for a month. Include salaries, ads, tools, agencies, and events. Divide that total by the number of new customers you closed that month.
If you spent $15,000 on marketing and sales in March and closed 30 customers, your CAC is $500.
But CAC alone doesn’t tell you much. You need to compare it to two other numbers.
First, compare CAC to your average revenue per customer in their first year. If your annual contract value is $1,200 and your CAC is $500, you’re profitable on year one. If your ACV is $300, you won’t break even until year two, which means you need more cash to grow.
Second, track CAC payback period. This is how many months it takes for a customer to generate enough gross margin to cover their acquisition cost. Calculate it by dividing CAC by monthly revenue per customer, then adjusting for gross margin.
If CAC is $500, monthly revenue is $100, and gross margin is 80%, your payback period is 6.25 months ($500 divided by $80). Most healthy SaaS businesses aim for payback under 12 months.
When CAC payback stretches past 18 months, growth becomes expensive. You need more capital to fund the gap between spending money and earning it back.
Cash Runway Tells You How Long You Can Survive
Runway is the number of months until you run out of money.
Take your current cash balance. Subtract your monthly burn rate (total expenses minus total revenue). Divide cash by burn.
If you have $60,000 in the bank and you burn $5,000 per month, you have 12 months of runway. If your burn is $8,000, you have 7.5 months.
Most founders track this monthly, but you should recalculate it weekly once you drop below 12 months. Burn rate changes faster than you think. A big annual software renewal, a new hire, or a spike in server costs can cut weeks off your runway overnight.
The goal isn’t to maximize runway by cutting everything. The goal is to know your number so you can make informed tradeoffs.
Spending $3,000 on an experiment that might improve conversion by 20% is smart if you have 18 months of runway. It’s reckless if you have 4 months.
Track runway alongside a simple forecast. If you’re growing MRR by $2,000 per month and burn is flat, when do you hit break-even? That date matters more than your current runway.
| Metric | What It Measures | Healthy Benchmark | Red Flag |
|---|---|---|---|
| MRR Growth | Month-over-month revenue increase | 10-20% for early stage | Flat or negative for 3+ months |
| Net Revenue Retention | Revenue expansion from existing customers | 100%+ | Below 90% |
| CAC Payback | Months to recover acquisition cost | Under 12 months | Over 18 months |
| Cash Runway | Months until funds run out | 12+ months | Under 6 months |
The One Efficiency Ratio That Connects Everything
Most frameworks suggest tracking CAC to LTV ratio, magic number, or Rule of 40. Those are useful at scale. But early-stage founders need something simpler.
Track revenue per dollar of burn.
Take your monthly revenue. Divide it by your monthly burn. If you generate $8,000 in revenue and burn $12,000, your ratio is 0.67. You’re spending $1.50 to generate $1.00 in revenue.
As you grow, this ratio should improve. When it crosses 1.0, you’re default alive. Every dollar you spend generates more than a dollar in return.
This single number tells you if your unit economics are moving in the right direction. It combines growth, retention, and efficiency into one metric you can check every month without a spreadsheet.
When the ratio improves, you’re getting more efficient. When it declines, something broke. Maybe CAC spiked. Maybe churn increased. Maybe you hired too fast. The ratio won’t tell you what broke, but it will tell you to start looking.
How to Track These Five Metrics Without Losing Your Mind
You don’t need expensive analytics software.
Start with a simple spreadsheet. Create one tab for each metric. Update them on the same day each month. The first of the month works well because most subscription billing aligns to calendar months.
For MRR, list every active customer with their plan value. Sum the column. Compare it to last month.
For NRR, tag customers by cohort (the month they joined). Filter to customers who joined 12 months ago. Compare their current MRR to their starting MRR.
For CAC, add up sales and marketing expenses from your bank statement. Divide by new customers from your signup list.
For runway, subtract monthly expenses from monthly revenue. Divide your bank balance by that number.
For efficiency ratio, divide revenue by burn.
The whole process takes 30 minutes once you set up the template.
If you’re pre-revenue or just validating your SaaS idea before writing a single line of code, you can skip MRR and NRR. Focus on burn and runway. Add the revenue metrics once you have paying customers.
Common Mistakes That Make Metrics Useless
Tracking metrics is easy. Tracking them correctly is harder.
Mixing time periods. Don’t compare MRR from the end of one month to the middle of another. Pick a consistent day and stick to it.
Ignoring cohorts. Averaging all customers together hides problems. Your January cohort might have 95% retention while your March cohort has 60%. The average looks fine, but you have a serious onboarding issue with recent signups.
Counting non-recurring revenue. Setup fees, consulting, and one-time purchases don’t belong in MRR. They inflate your numbers and make growth look better than it is.
Forgetting to adjust for discounts. If a customer pays $50/month because you gave them a 50% lifetime discount, their MRR is $50, not $100. Use actual cash received, not list price.
Tracking too many things. Every metric you add is one more thing to update, explain, and worry about. If you can’t remember all your key metrics without looking at a list, you’re tracking too many.
When to Add More Metrics
These five metrics work for most founders from first dollar to $1M ARR.
After that, you’ll want to add more granularity. Track MRR by customer segment, acquisition channel, and plan type. Break CAC into paid and organic. Measure activation rate, time to value, and feature adoption.
But don’t add metrics because they sound impressive. Add them when you have a specific decision to make and your current metrics don’t provide enough information.
If you’re trying to decide between two pricing strategies when you have zero customers, you might need to track conversion rate by price point. If you’re optimizing onboarding, you need activation metrics. If you’re scaling a sales team, you need pipeline coverage and win rate.
Add metrics to answer questions, not to fill dashboards.
What to Do When a Metric Goes Wrong
Metrics exist to trigger action.
If MRR growth slows, look at new customer acquisition and churn. Are fewer people signing up, or are more people leaving? The answer determines whether you need better marketing or better onboarding.
If NRR drops, segment by cohort and plan. Is churn concentrated in a specific customer type? Did you change something in the product or pricing that affected retention?
If CAC spikes, check your conversion rates at each funnel stage. Did traffic quality drop? Did your sales process get slower? Did you raise prices without adjusting messaging?
If runway shrinks faster than expected, identify which expenses increased. Was it planned (a new hire) or unplanned (server costs)? Can you delay anything non-essential?
The goal isn’t to panic when a number moves. The goal is to notice quickly and investigate systematically.
- Check if the change is real or a data error
- Segment the metric to find where the problem is concentrated
- Form a hypothesis about what caused the change
- Test one solution at a time so you know what worked
Most metric problems have simple explanations. You changed something in the product. A competitor launched. You ran out of easy prospects in your initial market. A big customer churned and skewed the average.
Treat metrics like symptoms. They tell you something hurts, but you still need to diagnose the underlying cause.
How to Report Metrics Without Overcomplicating Things
Investors and advisors will ask for updates.
Send a simple monthly email with your five core metrics, each with a one-sentence explanation of what changed and why.
MRR: $12,400 (up $1,800 from last month due to 18 new customers and 2 upgrades)
NRR: 108% (stable, driven by expansion in our agency segment)
CAC: $420 (down from $510 last month after pausing low-performing ad campaigns)
Runway: 14 months (extended from 11 months after reducing tool spend)
Efficiency ratio: 0.71 (improving from 0.64 as revenue grows faster than burn)
That’s it. No 40-slide deck. No charts that take an hour to build. Just the numbers and what they mean.
If someone wants more detail, they’ll ask. Most won’t. They just want to know you’re paying attention and making progress.
For your team, share the same metrics but focus on what each person can influence. Your marketer cares about CAC and new MRR. Your product lead cares about NRR and activation. Your ops person cares about burn and runway.
Make metrics visible, but don’t turn every conversation into a data review. Numbers inform decisions. They don’t make them.
Building Intuition Around What Good Looks Like
Benchmarks help, but context matters more.
A 5% monthly MRR growth rate sounds slow compared to venture-scale startups growing 20% per month. But if you’re bootstrapping a profitable micro-SaaS niche, 5% compounding monthly gets you to $100K ARR in under two years.
A 15-month CAC payback period sounds long. But if you’re selling annual contracts with 120% NRR, you’ll recover the cost and turn a profit well before the customer even considers churning.
Don’t optimize for arbitrary benchmarks. Optimize for your business model and growth stage.
Ask yourself three questions:
- Can I afford to keep doing this for 12 more months?
- Are customers staying and expanding, or leaving and complaining?
- Am I learning faster than I’m burning cash?
If the answer to all three is yes, your metrics are probably fine even if they don’t match some blog post’s ideal ranges.
Why These Metrics Work Better Than Alternatives
You’ll see other frameworks recommend different metrics.
Some emphasize LTV to CAC ratio. But LTV requires assumptions about future churn that early-stage founders can’t reliably make. A customer who’s been around for three months doesn’t give you enough data to predict their lifetime value.
Others focus on gross margin or magic number. Those matter at scale, but they’re less actionable when you’re pre-$1M ARR. You’re still figuring out your core product and ideal customer. Optimizing margin too early can lead you to cut things that actually drive retention.
The five metrics in this framework share one trait. You can measure them accurately with minimal data, and they connect directly to decisions you need to make this month.
Should you spend more on ads? Check CAC and runway. Should you focus on new features or customer success? Check NRR. Should you raise prices? Check MRR growth and churn trends.
Every metric answers a question you’re already asking.
Metrics That Actually Change How You Work
The best metric frameworks don’t just measure performance. They change behavior.
When you check MRR every month, you start noticing patterns. New signups spike after you publish a tutorial. Upgrades happen three weeks after onboarding emails. Churn concentrates in customers who never completed setup.
Those observations lead to experiments. You publish more tutorials. You adjust email timing. You build a better setup checklist.
When you track CAC, you stop spending money on channels that feel good but don’t convert. You double down on what works. You get pickier about who you target.
When you monitor runway, you make different tradeoffs. You negotiate annual contracts instead of monthly. You delay that hire until you hit the next revenue milestone. You cut tools you’re not actually using.
Metrics become a feedback loop. Measure, learn, adjust, measure again.
That loop is what separates founders who grow from founders who guess.
Making Metrics Part of Your Weekly Routine
You don’t need daily metric checks.
Monthly is enough for MRR, NRR, and CAC. Weekly is better for runway and efficiency ratio, especially if you’re early stage and burn is volatile.
Pick one day each week to update your numbers. Friday afternoon works well. You’re wrapping up the week, and the data is fresh enough to inform next week’s priorities.
Spend 15 minutes updating your spreadsheet. Another 15 minutes reviewing what changed and why. If something looks off, add it to your task list for Monday.
That’s it. No all-day analysis sessions. No metric paralysis. Just consistent attention to the numbers that matter.
Over time, you’ll develop intuition. You’ll know what good looks like for your business. You’ll spot problems before they become crises. And you’ll make better decisions because you’re working from data instead of vibes.
Why Fewer Metrics Beat More Metrics
The temptation is always to add more.
More metrics feel like more control. More visibility. More professionalism.
But every metric you add creates overhead. You have to collect it, update it, remember what it means, and explain it to other people. Most importantly, you have to decide whether to act on it.
The more metrics you track, the easier it is to cherry-pick the ones that make you feel good and ignore the ones that demand hard decisions.
Five metrics force clarity. If all five are green, you’re doing well. If one turns red, you know exactly where to focus.
You can always add more later. But start with the minimum set that keeps you honest and moving forward.
Turning Metrics Into Momentum
Numbers don’t build companies. Founders do.
But the right numbers tell you whether you’re building something people want, whether you can afford to keep going, and whether you’re getting better at turning effort into results.
Track MRR to know if you’re growing. Track NRR to know if your product works. Track CAC to know if growth is sustainable. Track runway to know if you’ll survive long enough to succeed. Track efficiency to know if you’re improving.
Everything else is noise.
Start simple. Update consistently. Act on what you learn. That’s how metrics actually matter.